 Every now an again, I brush off the dust from an old laptop I have in the corner, and boot-up a couple of forgotten python scripts.
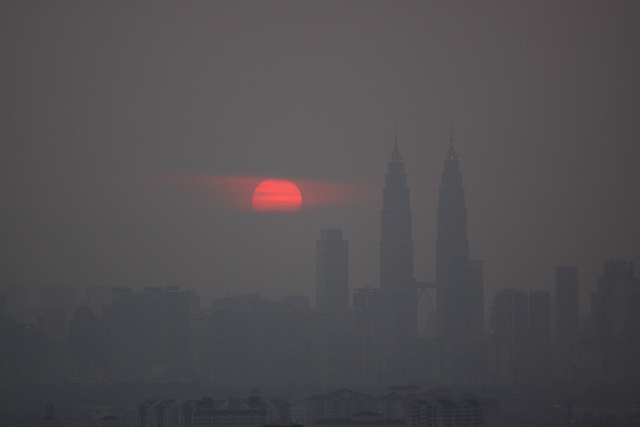
One of those scripts would scrap the DOE Malaysia website for API readings in Malaysia, unfortunately, those damn fools at the DOE now only publish 7-day data, and completely wipe off anything older–for some unknown reason.
I even contacted my ‘insider’ over at MDEC to help out, since she’s leading the open data initiative, but I’ve not had any response. So I’ve stopped work on the collating Malaysian API readings–for now. I suppose I could create a schedule job to scrape the website on a frequent basis, but that’s not something I’m interested in at the moment.
But on a lighter note, I did modify the script to scrape data from the Singapore National Environmental Agency–and here’s the latest PSI readings that go all the way back to April 2014, right up to yesterday (23-Mar-2016). This modification was part of my work last year to compare the PSI values that Singapore was reporting against the API values in Malaysia, (there was a wide discrepancy, check out my report here)
As usual they come in lovely csv files (separated by colons instead of commas, use the text to columns function in Excel to break them apart), and the full python script is fully available on my github page here.
All stuff produced on keithRozario.com is released under creative commons 4.0 (Attribution), which basically means who can use it for whatever you like–feel free, and don’t worry about the government either, nobody holds ‘copyright’ to facts like PSI readings (I don’t know why people often ask me this), and the Singapore government does make this freely available, but not in a easy to crunch csv file.
So without further delay, here’s the CSV files”
Singapore-PSI-Readings (click to download)
Enjoy.
P.S If this work has helped you in any way, would you mind leaving a comment below, helps me keep track of which of my crazy projects actually bring value to the wider community. Check out some climate change findings, based on my previous API reading work here.
TL;DR
For the truly un-initiated, here’s the Google Sheets version of the Singapore readings. They had to be in individual sheets, because together they exceeded the cell-limit in Google Sheets. All in all, it’s 17,000+ data points per region, so enjoy at your own risk 🙂
Hey Keith I’m not computer logic savvy and was curious if there is an easy way to pull together the data for Singapore going back farther than 2014. The NEA has data back to 2011, is the code easily modified to capture all of that historical info?
Pretty easy Eric, but I chose 01-Apr-2014 as the start date because that’s when the NEA harmonized the PSI to include PM2.5 values. Totally random and arbitary decision on my part.
The code will need to be tweaked a bit to go back to readings prior to this date to take into account the different format of the page, but not exactly a monumental effort 🙂
Keith